Presentation of results
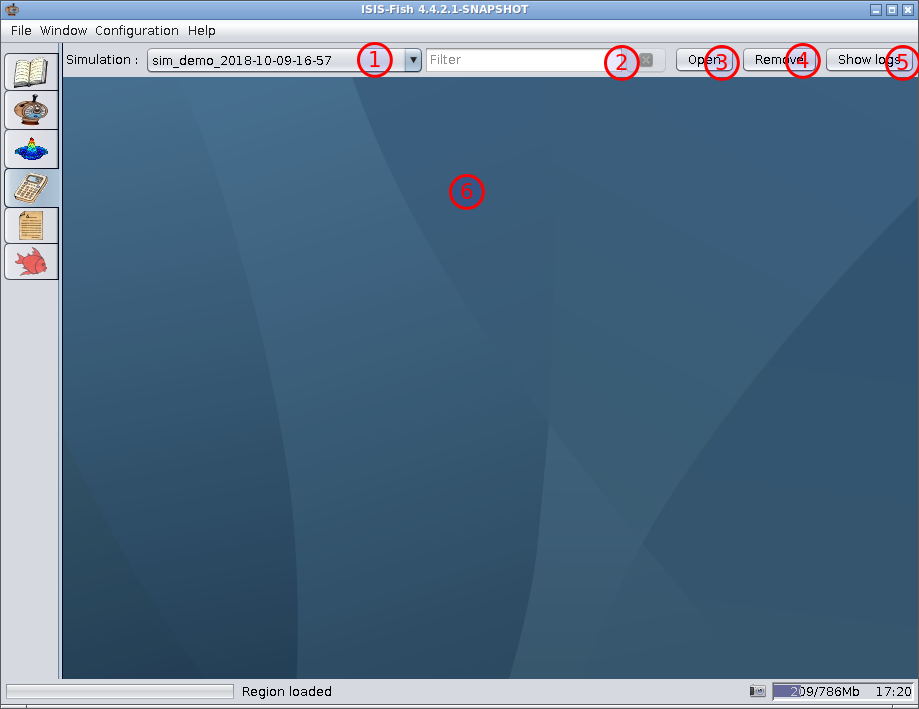
The results window presents a summary of the simulation and the results in graphical, cartographic or tabular format. It
can also be used to delete a simulation or view the simulation log.
Results window
-
Simulation – This lists all the simulations executed locally.
-
Filter – Filter for the simulation list.
The button to the right of the filter cancels the current simulation filter and refreshes list of simulations.
-
Open – When a simulation has been selected, click Open to display the summary of the results in the results
frame, Item 6.
-
Remove – Deletes the selected simulation.
-
Show Logs – Displays the log for the selected simulation.
-
Results Frame – The frame for displaying the results.
Results summary
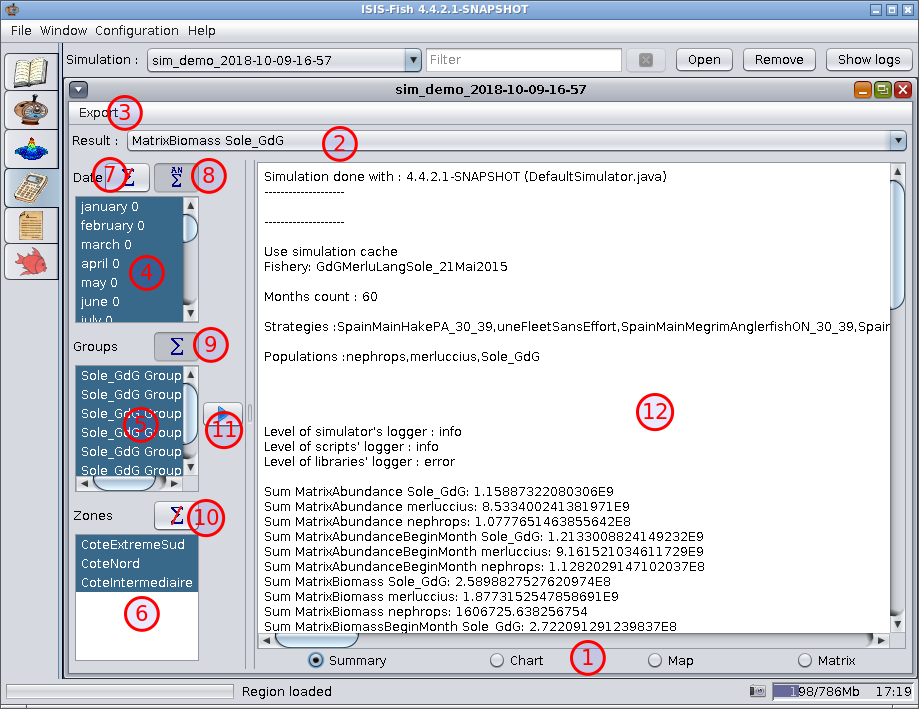
- Results selection bar – The type of results to be displayed are selected using the radio buttons. When a
simulation is loaded, the summary is selected.
- Result – Dropdown list of all the result matrices from the simulation
- Export menu – This menu is used to save a export from the simulation. When an export is selected, a dialog box is
opened to specify the file name and directory.
- Date – Select the period of interest.
- Headers for dimension 1 – Select the data range of interest.
- Headers for dimension 2 – Select the data range of interest.
- Sum across period – Sum the data across the period.
- Sum across year – Sum the data across the year.
- Sum across dimension 1 – Sum the data across dimension 1.
- Sum across dimension 2 – Sum the data across dimension 2.
- Display – Displays the data selected on the left.
- Summary – The summary of the simulation.
Graphical presentation of the results
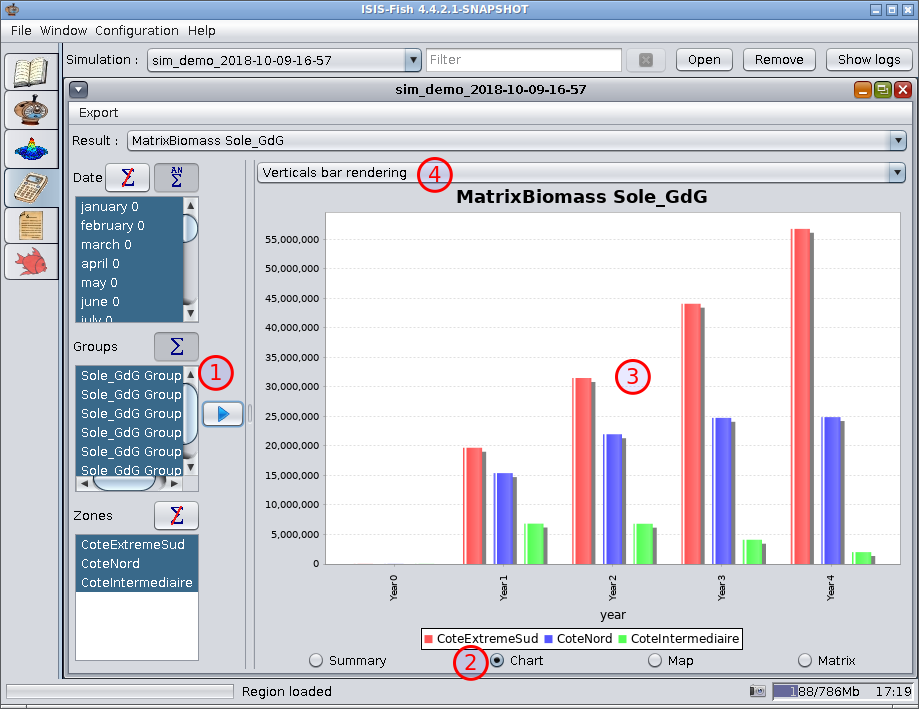
- Display – Displays the data selected on the left.
- Chart – Displays the data as a chart.
- The results displayed as a chart.
- Dropdown list of graphical display formats.
A right click on the chart displays a context menu for setting the chart properties (title, labels, format, etc.) saving
the chart as an image or printing it, zooming, etc.
Cartographic presentation of the results
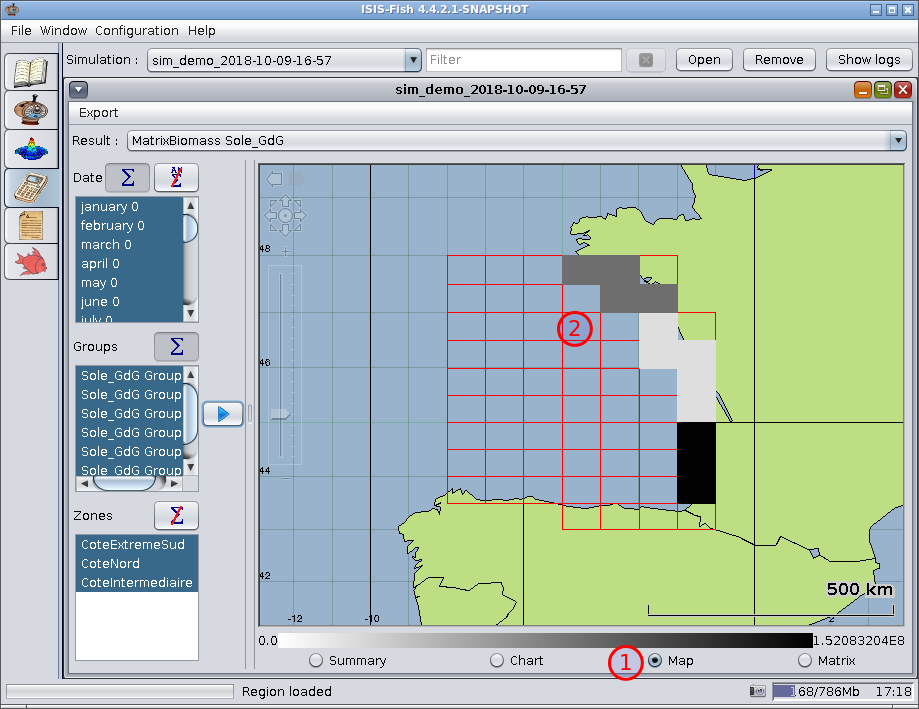
- Map – Displays the results on the map of the region.
- The map of the region with shades indicating the results in each cell.
Tabular presentation of the results
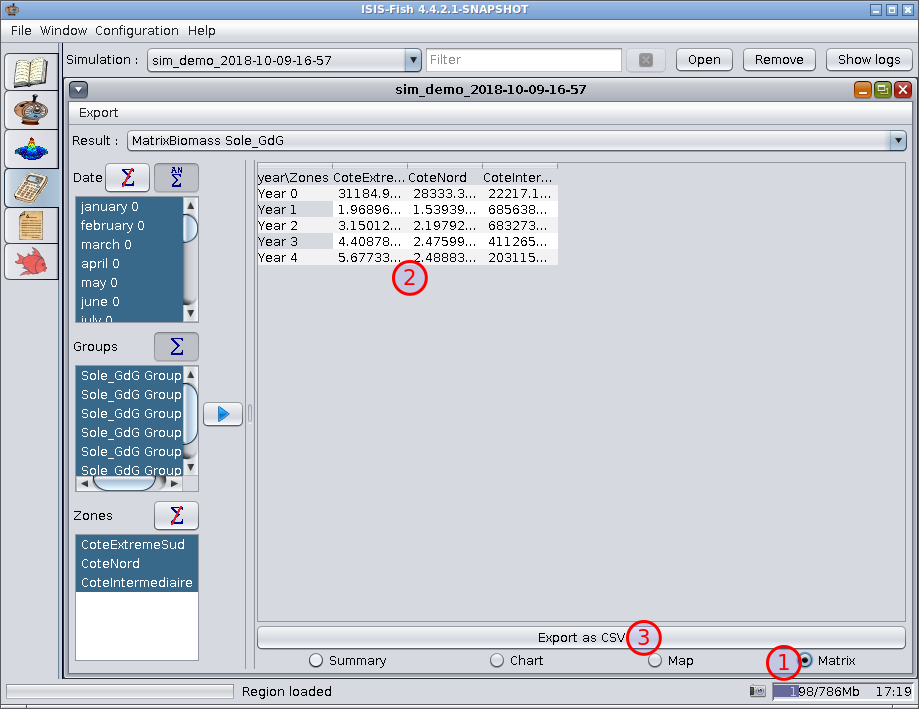
- Matrix – Displays the results matrix in a table.
- The results matrix.
- Export as CSV – Exports the results matrix as a CSV file. A dialog box is used to set the directory and filename.